1 Introduction
In this technote we describe how LSST DM/SQuaRE infrastructure will be used to generate the Data Management System (DMS) end-of-night report and discuss the adoption of this toolchain as the common reporting infrastructure to be shared accross the LSST subsystems, as requested in LCR-1203 [1].
DMS-REQ-0097 in LSE-61 [2] specifies the minimum content for the DMS end-of-night report:
Specification: The DMS shall produce a Level 1 Data Quality Report that contains indicators of data quality that result from running the DMS pipelines, including at least: Photometric zero point vs. time for each utilized filter; Sky brightness vs. time for each utilized filter; seeing vs. time for each utilized filter; PSF parameters vs. time for each utilized filter; detection efficiency for point sources vs. mag for each utilized filter.
Also, from DMS-REQ-0096, the Prompt Data Quality Report must be generated in less than 4h after the end of the nigthly Prompt Processing in order to evaluate whether changes to hardware, software, or procedures are needed for the following night’s observing.
During observations, the Prompt Processing pipeline, described in LDM-151 [3], will perform Single Frame Processing from which the data quality metrics specified in DMS-REQ-0097 can be derived for each CCD and Visit.
However, a more complete end-of-night report will require correlation of the data quality metrics with the state of the instrument, observing conditions, observatory and telescope telemetry, and with observer comments obtained from the observatory electronic log system. As a reference, see the Dark Energy Survey Night Summary [4] reports.
Figure 1 presents an overview diagram of the DMS end-of-night report components, mapped to existing tools developed by LSST DM/SQuaRE.
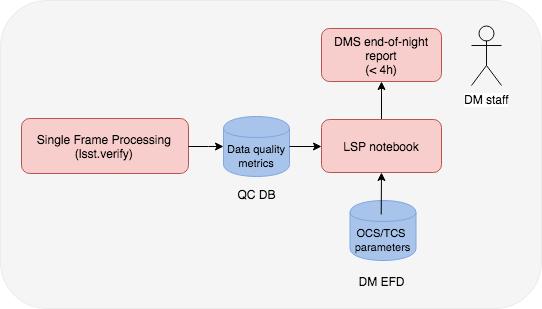
The LSST DM/SQuaRE toolchain is described in more details in the following sections. In Appendix A we present an initial list of the data quality metrics and parameters needed by the DMS end-of-night report.
2 Collecting data quality metrics with lsst.verify
The Prompt Processing pipeline is responsible for the reduction of raw or camera-corrected image data to calibrated exposures, the detection and measurement of Sources, the characterization of the point-spread-function (PSF), and the generation of an astrometric solution for an image.
Data quality metrics can be collected during the processing of each CCD in a visit (eg. zeropoints) or by an afterburner task. Normal processing tasks or QA-specific afterburner tasks can be instrumented by the LSST Verification Framework used to define and collect measurements of those metrics as demonstrated in SQR-019 [5].
Currently lsst.verify is being used to measure Key Performance Metrics derived from the LSST Sience Requirements Document (LPM-17 [6]) but it is generic and will be used to publish ad hoc metrics.
Metrics measured through lsst.verify will be uploaded to the LSST SQuaSH [7] infrastructure for curation and display.
3 Storing data quality metrics with SQuaSH
SQuaSH [7] is a metric store and monitoring system. Metrics are uploaded to SQuaSH using the lsst.verify framework. These metrics and their measured values are stored and tracked, making it possible to monitor regressions via a dahsboard interface or through alerts, including Slack notifications.
SQuaSH has a microservice architecture that makes it easier to reuse some of its components for the DMS end-of-night report, particular the SQuaSH database for storing the data quality metrics and its RESTful API as a programatic interface to access the results.
The Bokeh [8] plotting library is the data visualization technology used in SQuaSH [7]. We plan to use it for the end-of-night reports for creating rich and interactive visualizations as it integrates very well with the notebook environment. See SQR-022 [9] for an example of a custom chart implemented in Bokeh.
4 Implementing the end-of-night reports as Jupyter Notebooks with nbreport
We intend to implement the end-of-night reports as Jupyter notebooks using the notebook aspect of the LSST Science Platform (LSP [10]) to create report templates. The notebook will contain the code necessary to access the results from programatic APIs, the visualization code and the text narrative in a single place.
The notebooks will be executed on demand or on a schedule (e.g. via a cronjob) and the result will be published as a static page using the nbreport [11] tool. nbreport shares the same infrastructure for publishing technotes like this.
This will allow users to consume it as a document report if they do not need the interactive analytical capabilities offered by SQuaSH and the LSP.
5 Correlating with data in the DM-EFD
The DMS end-of-night report will need access to parameters like observing conditions, observatory and telescope telemetry obtained from the DM-EFD in near-realtime. That is envisioned as the main mechanism for OCS to DMS communication (see current discussion at DMTN-082 [14].)
The DM-EFD and the SQuaSH DB will have a common programatic interface through the DAX system (see current proposal at DMTN-082 [14]). This interface will be accessible from the LSP environment where near-realtime dashboard for observers and end-of-night data quality reports for DM staff can be implemented.
6 Conclusions
This technote summarizes LSST DM/SQuaRE’s toolchain and demonstrates its potential use to generate the DMS end-of-night report in particular, and more generally as a common reporting infrastructure to be shared accross the LSST subsystems. We describe the current tools showing examples of their use and integration. We suggest using lsst.verify to define and collect measurements of ad hoc metrics; SQuaSH as the metric store; the notebook aspect of the LSP as the development environment for implementing the reports powered by programatic APIs for accessing SQuaSH and the DM-EFD databases; and finally using the nbreport framework to produce static reports.
7 Appendix A - DMS end-of-night report: data quality metrics and parameters to store
DMS-REQ-0097 makes reference to data quality metrics from the Single Frame Processing pipeline for each CCD in a Visit. Calculating these values is the responsibility of the Science Pipelines team. Using the SQuaSH metric store, these metrics can also be aggregated at the Visit level.
- PSF FWHM
- PSF Ellipticiy
- Sky brightness
- Zeropoint
A number of relevant data quality parameters can be obtained from the DM-EFD itself, in addition to observatory and telescope telemetry.
- Start time (UTC): date and time in UTC when the Visit acquisition started.
- Visit ID: unique identifier of the Visit.
- RA, Dec: Telescope pointing.
- Airmass: Even though it can be calculated from RA, Dec it is useful to store Airmass since it determines the expected atmospheric contribution to the image quality.
- Filter: One of the five LSST observing filters, ugrizy.
- Focus: The donut estimate of focus error for the Visit.
- Guider DeltaRA, DeltaDec: Guider displacements for TCS correction
- DIMM seeing: seeing determined by the observatory
- Wind vector: anamometer data from site weather stations
Note
Not clear if/when focus and guider information is available; should add to an ICD if required.
8 Appendix B - Notes on the Prompt Quality Control Software
From OCS-DM-COM-ICD-0021 in LSE-72 [13] the imediate data quality feedback to the OCS/Scheduler is important because it impacts the short term scheduling.
The rapid cadence and scale of the LSST observing program requires each visit to be scheduled shortly before it is observed to make optimal use of conditions that vary with time like observing conditions, observatory and telescope parameters, survey completion, etc. That can be achieved only with automated data quality feedback from the Data Management System (DMS)/Prompt Quality Control to the Observatory Control System (OCS)/Scheduler to assess whether visits acquired should be scored as successful and to assess the general observing quality – e.g., weather and seeing – across the sky.
Data quality metrics will be published to the OCS/Scheduler throught a Telemetry Gateway at the Base Facility, as defined in LDM-148 [12], which will then convert the messages into telemetry for the OCS Service Abstraction Layer (SAL) as specified by OCS-DM-COM-ICD-0017 . In particular, OCS-DM-COM-ICD-0019 provides a minimum set of events and telemetry to be published to the OCS.
While the detailed implementation of the Telemetry Gateway is not yet defined, we assume that data quality metrics, with a granularity level suitable for the OCS/Scheduler, will be published to the OCS/Scheduler and also persited to the SQuaSH DB. See also OCS-DM-COM-ICD-0020 regarding persistence of data quality metrics to the EFD.
Note
We need a requirement that specifies the frequency and granularity of the data quality feedback to OCS/Scheduler. This decision impacts the Prompt Processing pipeline design and the maximum time the Scheduler will wait for that information before fallback.
Note
The current plan is that DMS will not publish a pass/fail data quality flag to the OCS/Scheduler to determine if a visit needs to be scheduled for reobservation. But, what about artifacts that affect image quality that cannot be analysed by the OCS/Scheduler software? (e.g. focus/alignment or guider problems) how visits with these problems get reobserved?
9 References
| [1] | https://project.lsst.org/groups/ccb/node/2174 |
| [2] | https://docushare.lsstcorp.org/docushare/dsweb/Get/LSE-61 |
| [3] | https://docushare.lsstcorp.org/docushare/dsweb/Get/LDM-151 |
| [4] | http://des-ops.fnal.gov:8080/nightsum |
| [5] | https://sqr-019.lsst.io |
| [6] | https://docushare.lsstcorp.org/docushare/dsweb/Get/LPM-17 |
| [7] | (1, 2, 3) https://squash.lsst.codes/ |
| [8] | https://bokeh.pydata.org/en/latest/ |
| [9] | https://sqr-022.lsst.codes/ |
| [10] | https://nb.lsst.io/ |
| [11] | https://community.lsst.org/t/previewing-nbreport-lssts-new-jupyter-notebook-based-report-system/3125 |
| [12] | https://docushare.lsst.org/docushare/dsweb/Get/Version-52084/LDM-148.pdf |
| [13] | https://docushare.lsst.org/docushare/dsweb/Get/Version-51094/LSE-72%20ReportGen%20by%20ID%2004-19-18%20DRAFT.pdf |
| [14] | (1, 2) https://dmtn-082.lsst.io/ |